Terrain add-ons

See the shape of your land.

Contours, slope classes and how many hectares of each paddock sit on each slope. It’s built from the national LiDAR elevation model and matched to the paddocks on your farm map.
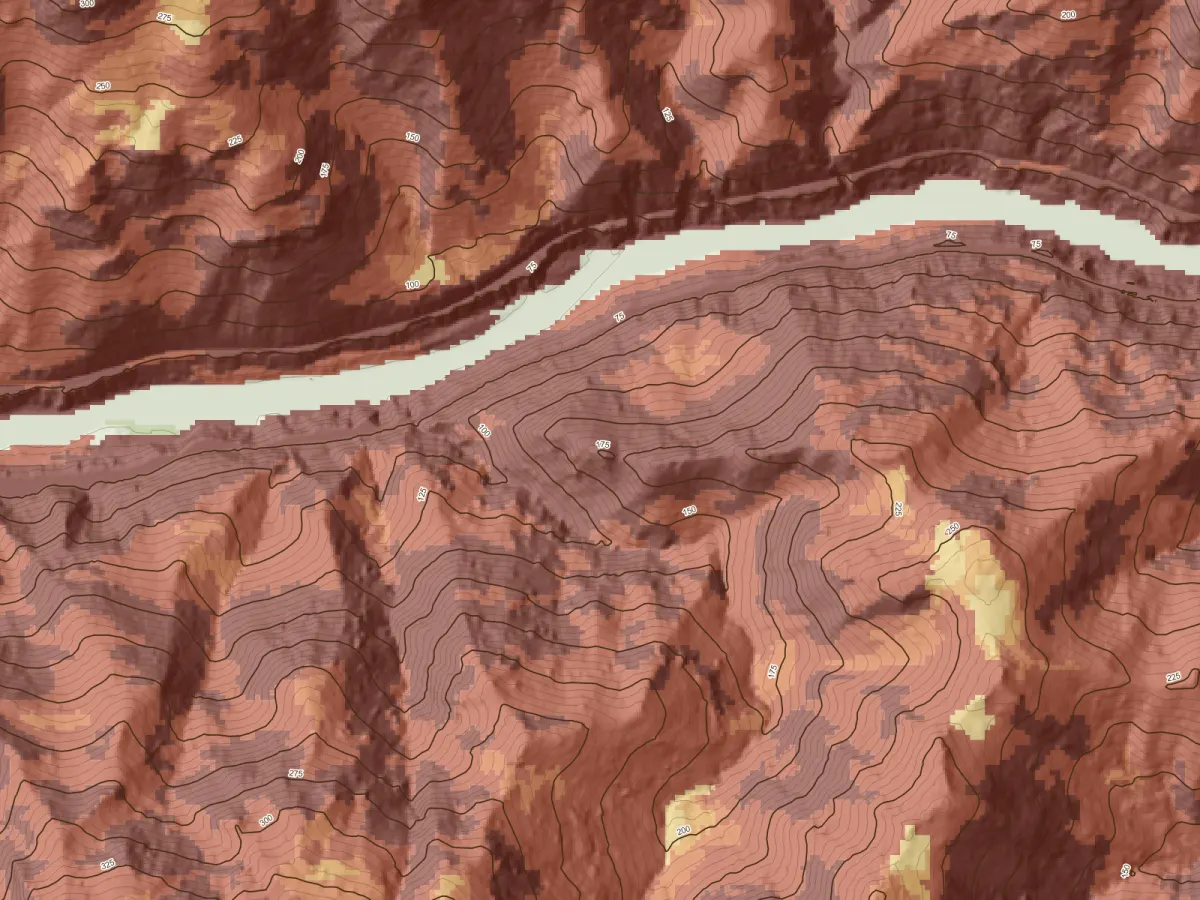
Terrain sample: hillshaded LiDAR relief coloured by slope class, with 5 metre contours and labelled 25 metre index contours either side of a river gorge.
Sample: steep reserve land in the Manawatū Gorge, from the LINZ New Zealand LiDAR 1m DEM. Sourced from the LINZ Data Service and licensed by Toitū Te Whenua Land Information New Zealand, for re-use under CC BY 4.0.

What the colours mean

Slope classes you can plan with.

Slope is grouped into the NZ Land Use Capability slope classes, from flat to very steep. With the terrain bundle, every paddock gets its hectares in each class, so you can see how much of it is easy country and how much isn’t.

  • A Flat to gently undulating (0–3°)
  • B Undulating (3–7°)
  • C Rolling (7–15°)
  • D Strongly rolling (15–20°)
  • E Moderately steep (20–25°)
  • F Steep (25–35°)
  • G Very steep (over 35°)

Contours: 5 m interval with labelled 25 m index lines on farm sheets. Heights are NZVD2016.

Two options

Choose what you need.

Both are added to a farm we map. Order them with a new farm map, from $750 for Baseline, or add them later to a farm we have already mapped.

Elevation and contours

$250one-off · NZD, excluding GST

  • Existing mapped site
  • Terrain PDF and contour data
  • Source suitability assessment required
Discuss Elevation and contours

Terrain analysis bundle

$450one-off · NZD, excluding GST

  • Elevation and contours
  • Slope map and area schedule
  • Existing mapped site; suitable terrain source required
Discuss Terrain analysis bundle
See the farm mapping packages

What you receive

The sheet, the data and where it came from.

  • An A3 terrain sheet: hillshade, contours and your farm boundary
  • Contour lines as mapped data you can open in QGIS, ArcGIS and most mapping software
  • With the bundle: a slope class map and an area-by-slope spreadsheet for every paddock
  • A source note naming the LiDAR survey, when it was flown, the height datum and its stated accuracy

Checked before you pay

Not every property has the data.

We check LiDAR coverage for your boundary first. If the national 1m model covers less than 95% of your property, we don’t offer terrain for it, and we tell you before you pay rather than hand you a map with holes in it.

These products currently use LINZ data, so they’re available for New Zealand properties. Mapping somewhere else? Ask us and we’ll see what reliable data exists.

Honest about the limits.

  • A 1 m grid is not 1 m accuracy. The LINZ LiDAR specification states ±0.2 m vertical (95%).
  • It’s a bare-earth model. Trees, buildings, and earthworks or slips since the survey aren’t shown.
  • It supports farm planning. It is not a survey, and it is not for engineering, drainage design or regulatory decisions without professional advice.
  • Terrain sheets show the survey date, so you always know how current the picture is.

All prices NZD, excluding GST. Standard orders are paid fully upfront after scope and data coverage are confirmed.